Insight: CQC action due at Oakwood in 6 days
From scattered data to insights you can act on.
Occupancy, staffing, finance and compliance data from every system you run. Joined into one live picture and turned into decisions.
Sitting on a goldmine.
Not mining it.
Each system tells its own small story with occupancy here, staffing there and incidents somewhere else. The real insight lives between them and disconnected systems can never show you it.
They have become part of our operations team. It's not just about delivering a platform, they engage with our staff, make them feel comfortable and make changes quickly so everyone feels confident in using the system to their advantage.
They have become part of our operations team. It's not just about delivering a platform, they engage with our staff, make them feel comfortable and make changes quickly so everyone feels confident in using the system to their advantage.
One brain for your whole estate.
Plug in the systems you already have. CareSignals connects them, correlates them and tells you what matters.
- Care planning
- eMAR
- Staffing & rota
- Finance
- Compliance
- Occupancy / CRM

- Live dashboardsEvery home, every metric, in one view.
- Automated reportingBoard packs and CQC reports, generated.
- Alerts & signalsThe moment something needs attention.
- AI insightPatterns and forecasts you'd otherwise miss.
As ambitious as AI gets.
As guarded as care demands.
The earliest warnings in a care group are written down, not counted. Complaints, incident narratives, survey comments. The story is sitting there weeks before it reaches your occupancy, your agency spend or your inspection.
CareSignals listens at estate scale. Every narrative read, scored and joined to the numbers you already track. A complaint about staffing continuity stops being a note on a file and becomes a signal, correlated with agency use, incidents and empty beds at the same home.
Built the way care demands with self-hosted models on dedicated infrastructure, sitting inside the same guarded environment as everything else we run for you.
NO PUBLIC AI SERVICES.
“...never the same carers two weeks running, and mum has to explain everything again each time. Weekends feel short-staffed...”
Insight: staffing continuity risk emerging at Greenfordstaffing continuity risk emerging at Greenford, correlating with rising agency use
The platform, piece by piece.
Built on the CareSignals framework, shaped to how your group runs.
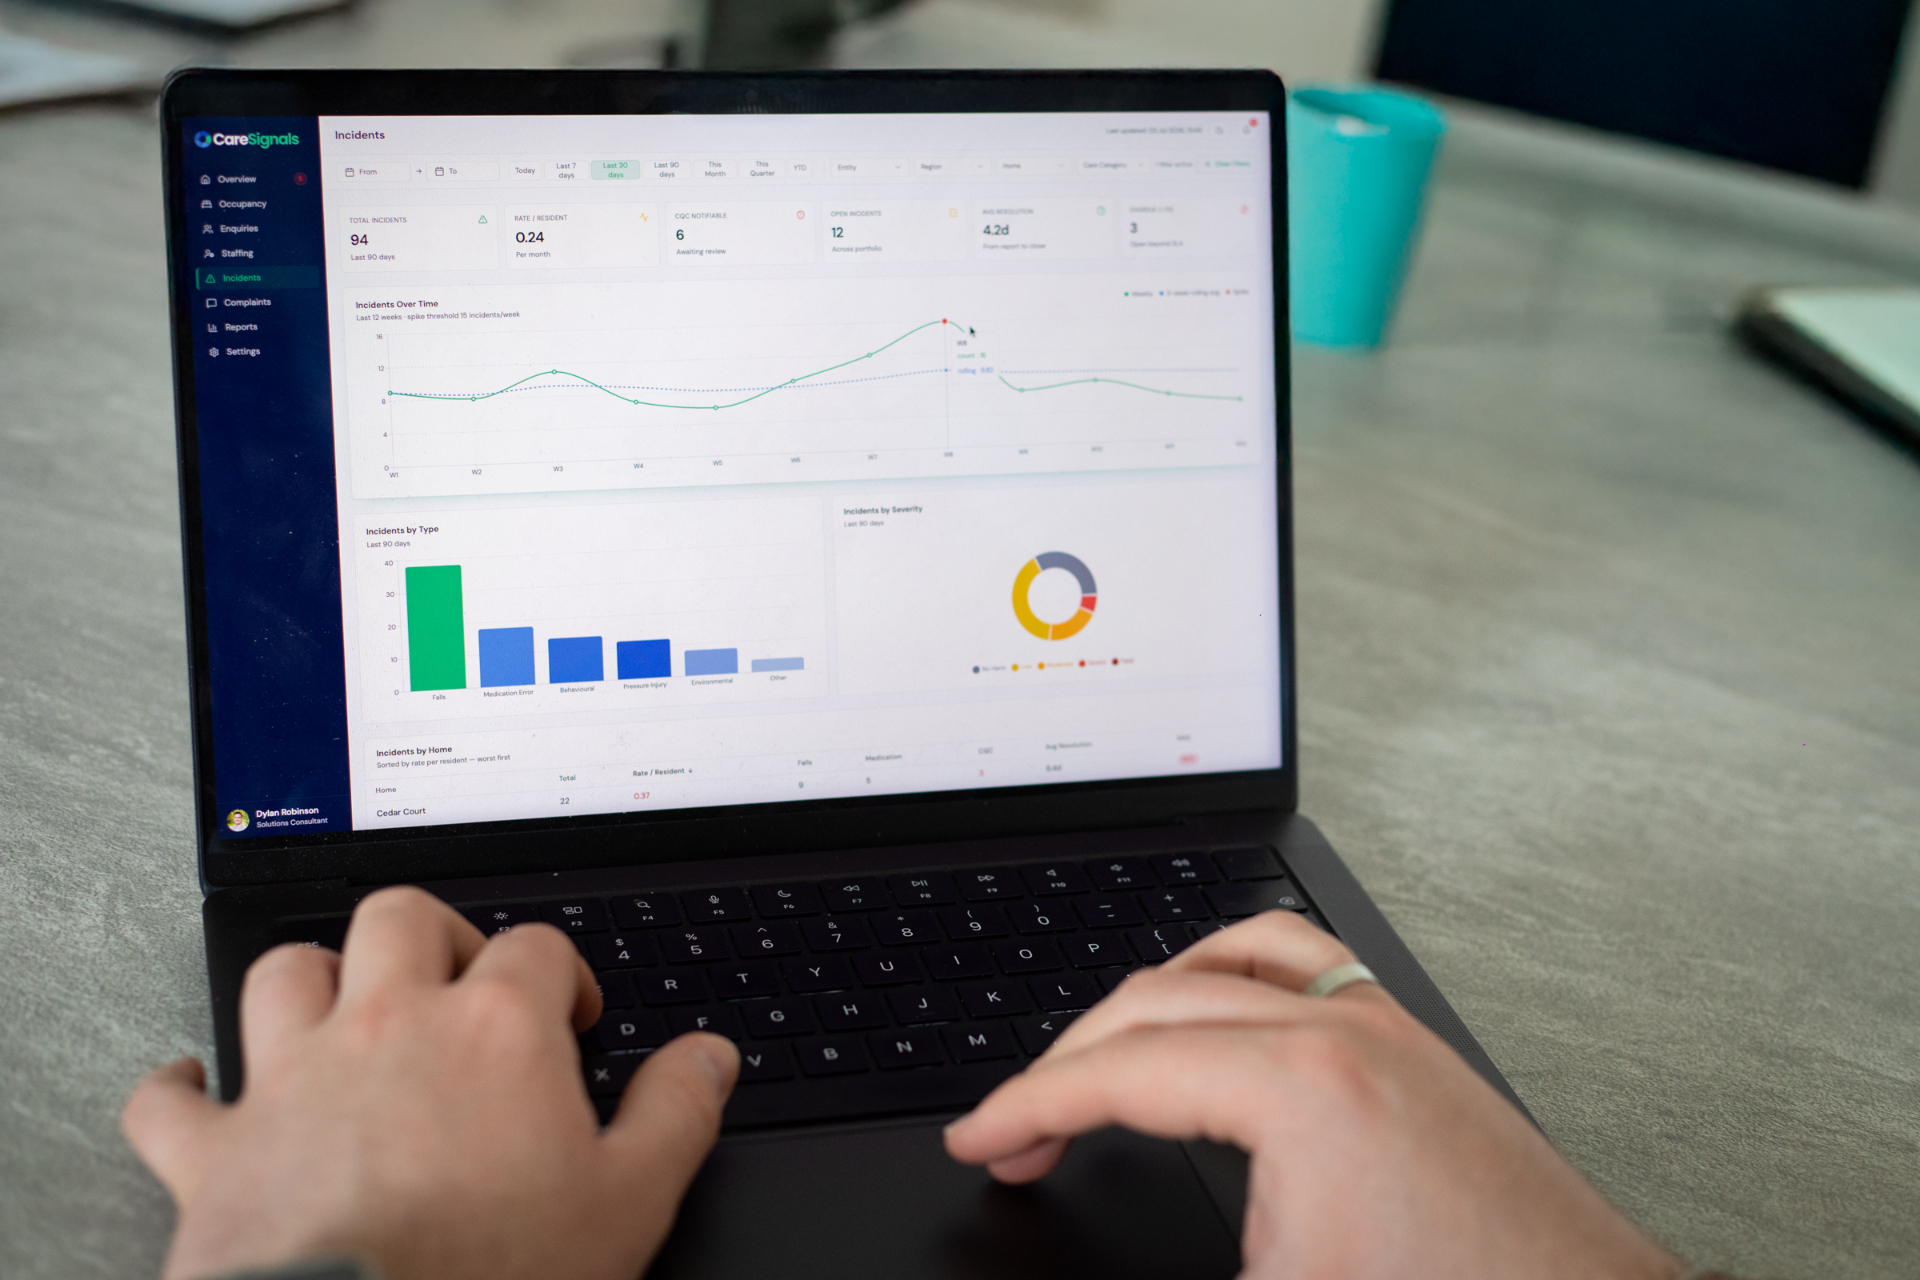
Every home rated red, amber or green, with the evidence one click down. From the whole group to a single unit, it's the same picture at every level.
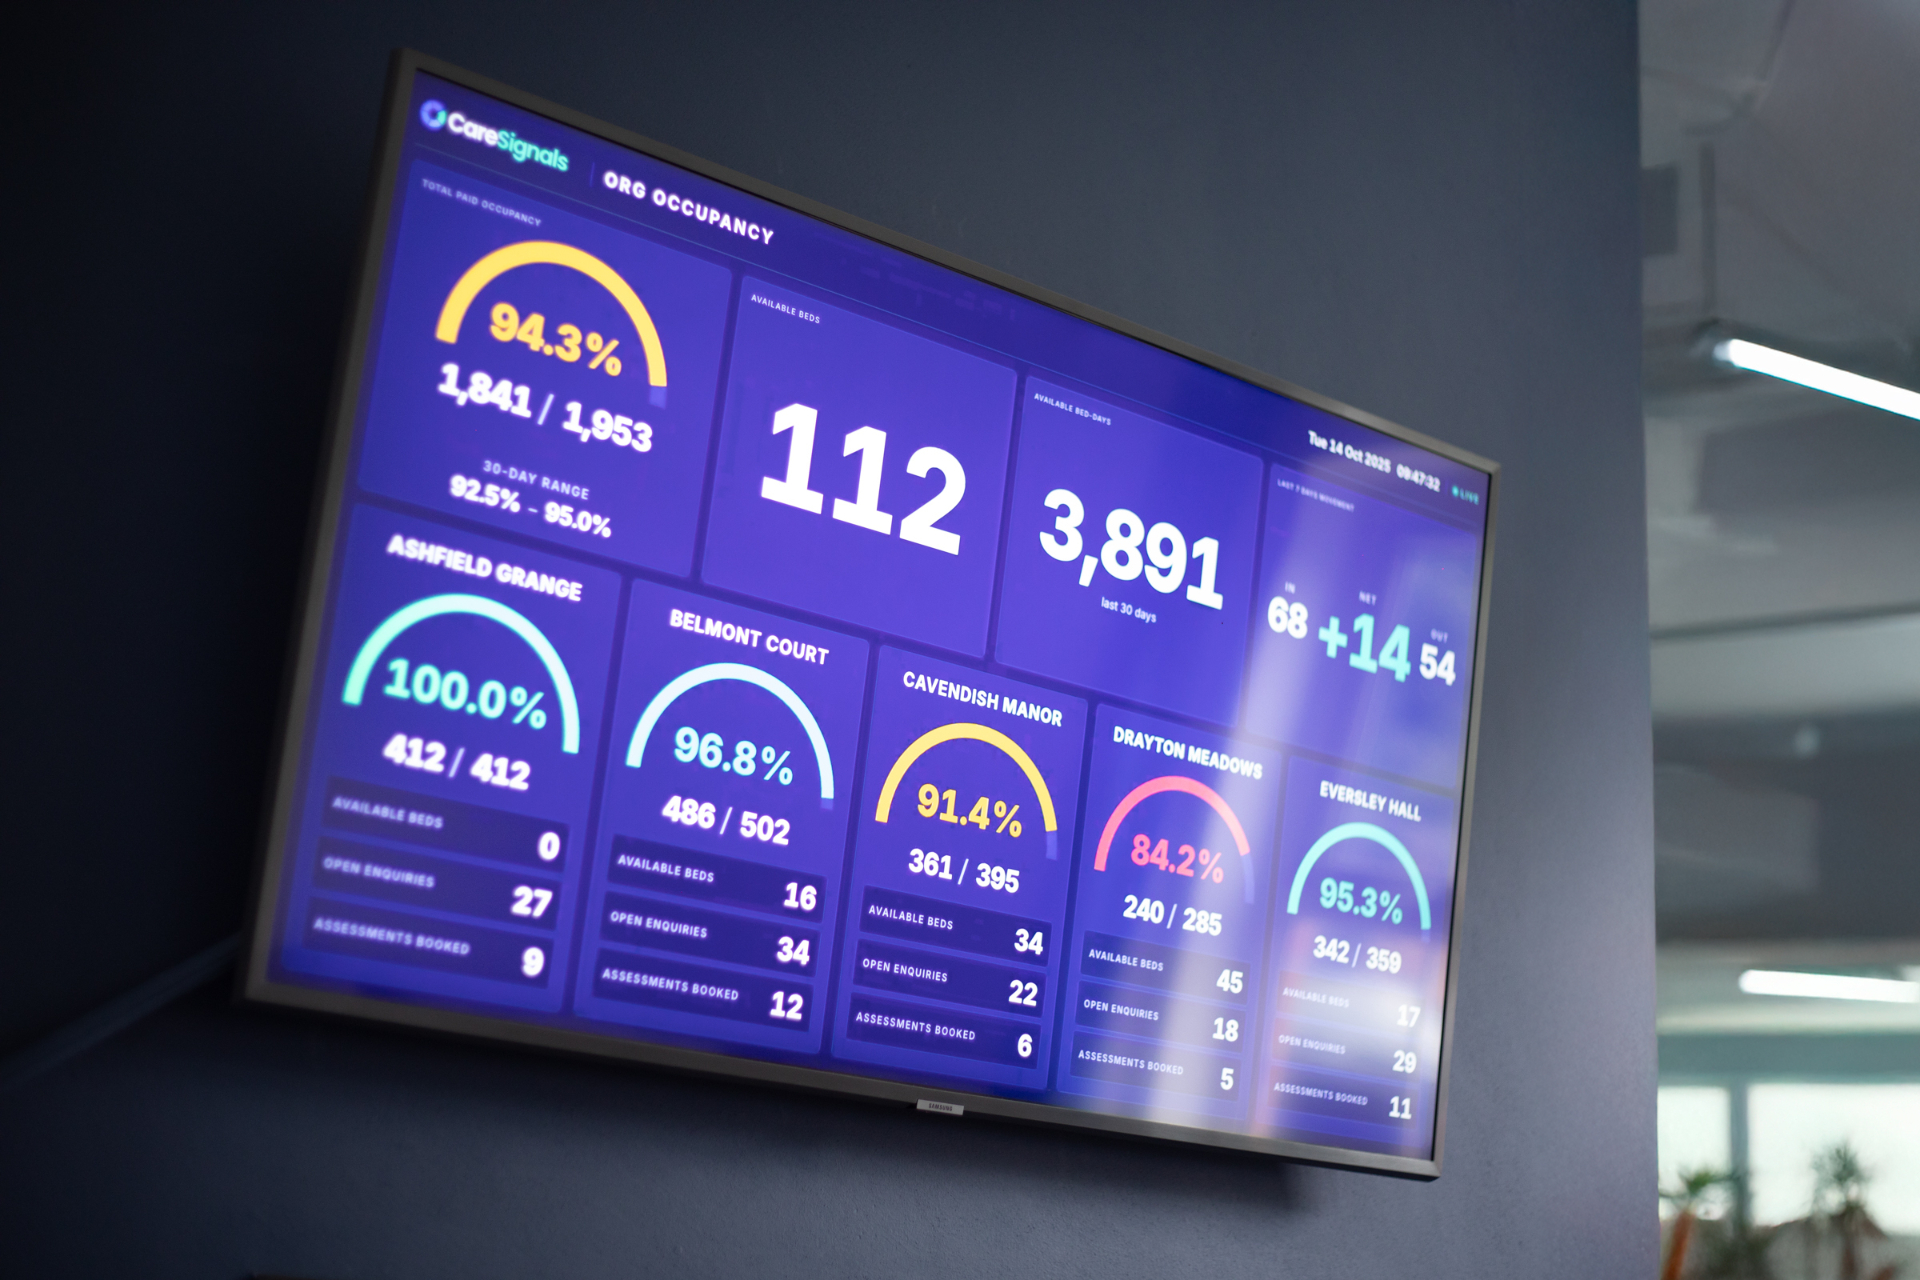

The estate on the wall, live all day at group, entity and home level. Walk past it and you know where things stand without opening a laptop.
Board packs and regulator-ready reports, generated from live data instead of a month-end scramble. The numbers agree with the dashboards because they come from the same place.
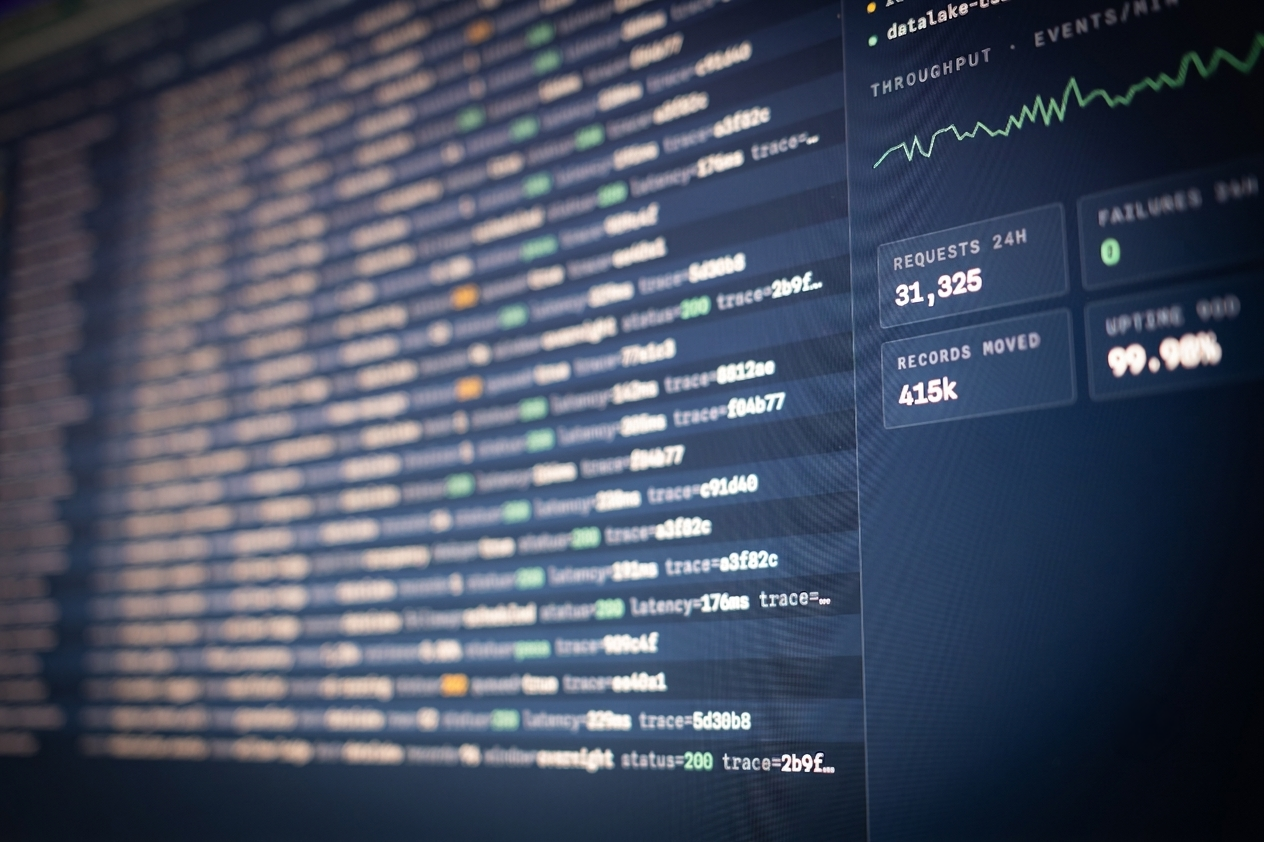
Your systems feed CareSignals and CareSignals feeds them back. When two systems need the same information, it moves once, instead of being rekeyed by somebody in the office.
Connect
Nothing ripped out or replaced.
Model
Seeing what systems can't.
Deliver
Board packs and alerts on phones.
Evolve
new questions. It grows with you.
A number is where most reporting stops. It's where we start.
REPORTING
STOPS
HERE

These voids are staffing-driven, not demand.
The same staffing instability is driving the rating, the lost enquiries and the empty beds. High-value beds sitting idle, for a reason you can fix.
A dashboard shows you the number. CareSignals tells you why, what it costs, and what to do about it.
Every seat, answered from one view.
Head of Governance
“Show me the ten homes we need to work on.”
A live ranked list, evidence one click down.
Commercial Director
“Why are these beds still empty?”
Every enquiry, from first call to admission, in one funnel.
People Director
“How exposed are we on agency staff?”
Every home's agency share, and where it's rising.
Operations Director
“What needs my attention this Monday?”
A weekly briefing that ranks itself.
Four seats, one home in common. Greenford looks different from every chair.
CareSignals shows them all the same truth.
Questions, answered.
No. CareSignals connects to what you already run, whether that's Nourish, Xero, CoolCare or a spreadsheet somebody built years ago. Nothing gets removed out and nobody has to learn a new system to keep doing their job.
Weeks, not months. First dashboards appear as soon as the first systems are connected, and the picture fills out from there.
On servers in the UK and EU run by us, for you. It's never shared, never sold and never used to train anything. Our AI runs on our own infrastructure, not through public AI services.
You'd be in good company. Most care groups we meet have data scattered across spreadsheets, systems that disagree with each other and month-end numbers nobody fully trusts. That's not a reason to wait, it's the exact problem we exist to fix.
Something else on your mind? Get in touch and ask us directly.